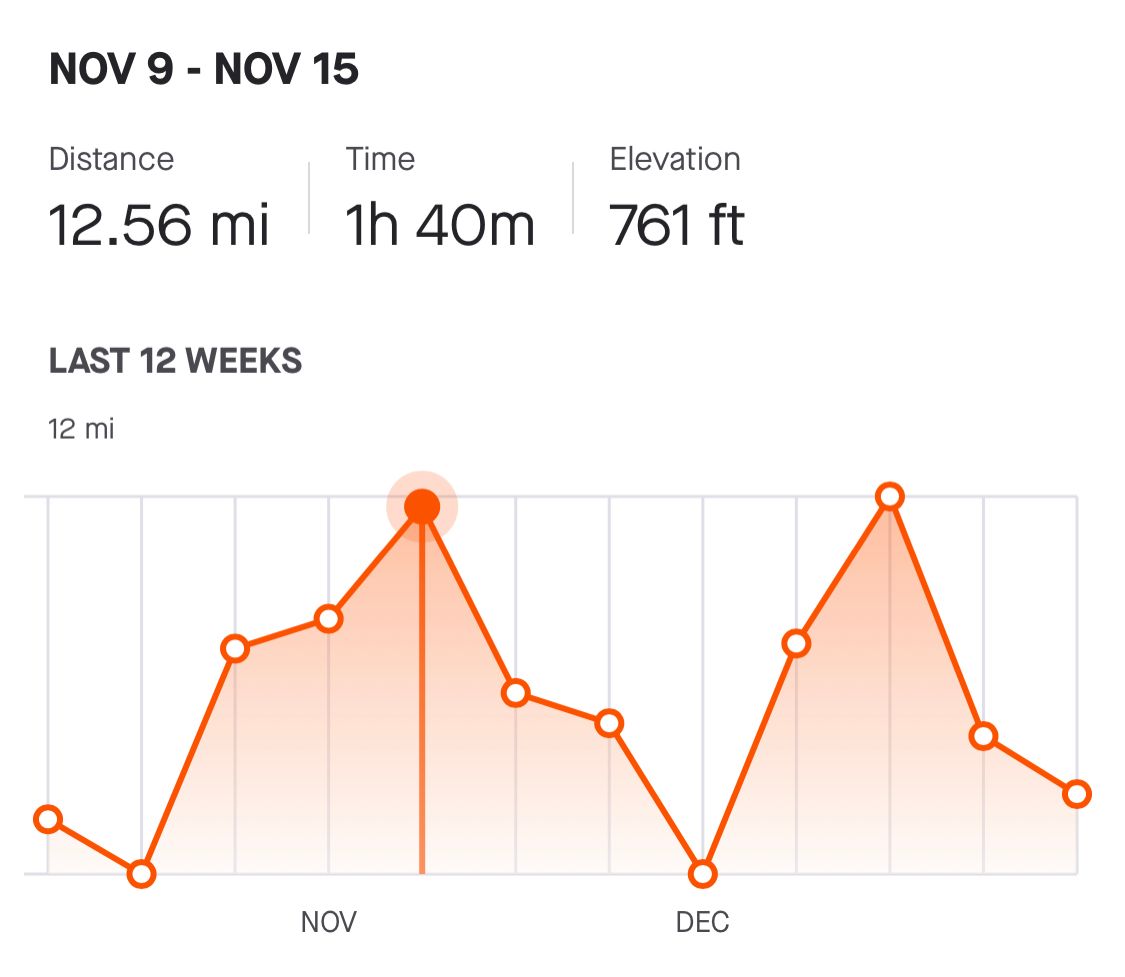
This week's SwiftUI tutorial is focusing on a popular running and cycling app, Strava. In this tutorial I'll walk through how I recreated the activity history graph which is displayed inside the Strava app. As usual, I'll break it down into bite size chunks and explain along the way.
If you found this tutorial helpful, please consider subscribing using this link, and if you aren't reading this on TrailingClosure.com, please come check us out sometime!
Overview
We'll break this post up into a few different parts. Feel free to click on a link to a section to skip ahead or jump around at your leisure.
The Model - ActivityLog
If we're going to be recreating a view that shows activity history, then we'll need some way to organize and store the data. Below is the struct definition for ActivityLog. We'll use this to store our activity data for which we'll display in the graph and text. (We won't be implementing unit conversion for the purposes of this tutorial)
struct ActivityLog {
    var distance: Double // Miles
    var duration: Double // Seconds
    var elevation: Double // Feet
    var date: Date
}
In addition to this we'll define some test data to help us out along the way.
class ActivityTestData {
    static let testData: [ActivityLog] = [
            ActivityLog(distance: 1.77, duration: 2100, elevation: 156, date: Date(timeIntervalSince1970: 1609282718)),
            ActivityLog(distance: 3.01, duration: 2800, elevation: 156, date: Date(timeIntervalSince1970: 1607813915)),
            ActivityLog(distance: 8.12, duration: 3400, elevation: 156, date: Date(timeIntervalSince1970: 1607381915)),
            ActivityLog(distance: 2.22, duration: 3400, elevation: 156, date: Date(timeIntervalSince1970: 1606604315)),
            ActivityLog(distance: 3.12, duration: 3400, elevation: 156, date: Date(timeIntervalSince1970: 1606604315)),
            ActivityLog(distance: 9.01, duration: 3200, elevation: 156, date: Date(timeIntervalSince1970: 1605653915)),
            ActivityLog(distance: 7.20, duration: 3400, elevation: 156, date: Date(timeIntervalSince1970: 1605653915)),
            ActivityLog(distance: 4.76, duration: 3200, elevation: 156, date: Date(timeIntervalSince1970: 1604876315)),
            ActivityLog(distance: 12.12, duration: 2100, elevation: 156, date: Date(timeIntervalSince1970: 1604876315)),
            ActivityLog(distance: 6.01, duration: 3400, elevation: 156, date: Date(timeIntervalSince1970: 1604185115)),
            ActivityLog(distance: 8.20, duration: 3400, elevation: 156, date: Date(timeIntervalSince1970: 1603234715)),
            ActivityLog(distance: 4.76, duration: 2100, elevation: 156, date: Date(timeIntervalSince1970: 1603234715))
    ]
}
Now that we have the model defined we can divert our attention to start creating the custom SwiftUI View.
Constructing the Graph
We're going to start by creating a new SwiftUI View file and naming it ActivityGraph. It will take in an ActivityLog array as well as a binding for the currently selected week's index. Strava only shows the last 12 weeks, so that's what our index will cover (0-11).
struct ActivityGraph: View {

    var logs: [ActivityLog]
    @Binding var selectedIndex: Int

    init(logs: [ActivityLog], selectedIndex: Binding<Int>) {
        self._selectedIndex = selectedIndex
        self.logs = logs // Temporary, we'll group logs next
    }

    var body: some View {
        // Nothing yet...
    }
}
Grouping Logs by Week
If you think back to our model, the ActivityLog struct only represents one single activity (such as a run, walk, hike, etc.). However, we can also use it to aggregate the whole week's stats into one ActivityLog. We'll do exactly this inside the init() for ActivityGraph. This allows us to simplify the creating of the graph by compressing the logs array down to only 12 instances. See below for how it's done.
Note, this is a rolling view of the history. The stats are not going to be grouped from the start of each week, but rather 7 day increments starting from the current day.
init(logs: [ActivityLog], selectedIndex: Binding<Int>) {
    self._selectedIndex = selectedIndex

    let curr = Date() // Today's Date
    let sortedLogs = logs.sorted { (log1, log2) -> Bool in
        log1.date > log2.date
    } // Sort the logs in chronological order

    var mergedLogs: [ActivityLog] = []

    for i in 0..<12 { // Loop back for the past 12 weeks

        var weekLog: ActivityLog = ActivityLog(distance: 0, duration: 0, elevation: 0, date: Date())

        for log in sortedLogs {
            // If log is within specific week, then add to weekly total
            if log.date.distance(to: curr.addingTimeInterval(TimeInterval(-604800 * i))) < 604800 && log.date < curr.addingTimeInterval(TimeInterval(-604800 * i)) {
                weekLog.distance += log.distance
                weekLog.duration += log.duration
                weekLog.elevation += log.elevation
            }
        }

        mergedLogs.insert(weekLog, at: 0)
    }

    self.logs = mergedLogs
}
Drawing the Grid
Currently the body code is empty. Let's start by drawing the grid for our graph. I'm going to write functions for each piece of the graph to make the body code easier to read. For example:
var body: some View {
    drawGrid()
        //.opacity(0.2)
        //.overlay(drawActivityGradient(logs: logs))
        //.overlay(drawActivityLine(logs: logs))
        //.overlay(drawLogPoints(logs: logs))
        //.overlay(addUserInteraction(logs: logs))
}
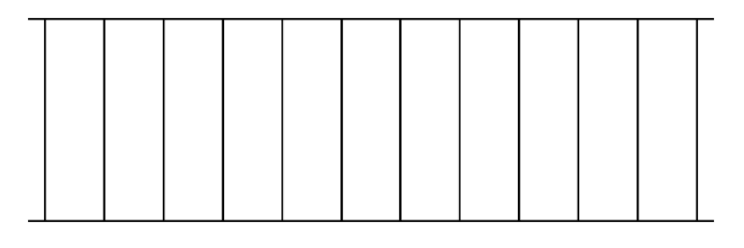
This is how the body code will look like. We'll write the drawGrid function first, and uncomment later functions as we write them. The drawgrid() function is fairly straightforward. We have two horizontal black lines that encompass a group of vertical black lines. You can see I let SwiftUI do all the heavy lifting of properly spacing out the lines. The only thing we need to make sure to do is set the width or height of lines.
func drawGrid() -> some View {
    VStack(spacing: 0) {
        Color.black.frame(height: 1, alignment: .center)
        HStack(spacing: 0) {
            Color.clear
                .frame(width: 8, height: 100)
            ForEach(0..<11) { i in
                Color.black.frame(width: 1, height: 100, alignment: .center)
                Spacer()

            }
            Color.black.frame(width: 1, height: 100, alignment: .center)
            Color.clear
                .frame(width: 8, height: 100)
        }
        Color.black.frame(height: 1, alignment: .center)
    }
}
Drawing the Line's Gradient
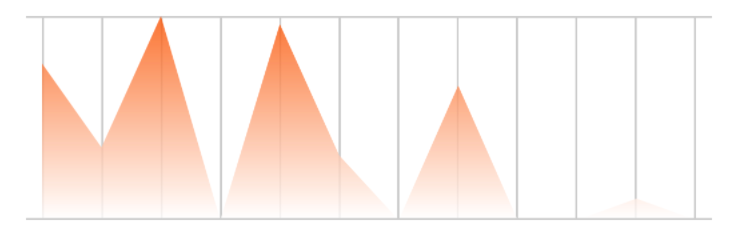
Next up, we'll write the drawActivityGradient(logs:) function. This will add a bit of styling to the graph to better showcase the high/lows of the data. The thinking behind this function is to create a LinearGradient that's in the shape of a rectangle, and then mask it off using the graph data. Let's take a look at the code.
func drawActivityGradient(logs: [ActivityLog]) -> some View {
    LinearGradient(gradient: Gradient(colors: [Color(red: 251/255, green: 82/255, blue: 0), .white]), startPoint: .top, endPoint: .bottom)
        .padding(.horizontal, 8)
        .padding(.bottom, 1)
        .opacity(0.8)
        .mask(
            GeometryReader { geo in
                Path { p in
                    // Used for scaling graph data
                    let maxNum = logs.reduce(0) { (res, log) -> Double in
                        return max(res, log.distance)
                    }

                    let scale = geo.size.height / CGFloat(maxNum)

                    //Week Index used for drawing (0-11)
                    var index: CGFloat = 0

                    // Move to the starting y-point on graph
                    p.move(to: CGPoint(x: 8, y: geo.size.height - (CGFloat(logs[Int(index)].distance) * scale)))

                    // For each week draw line from previous week
                    for _ in logs {
                        if index != 0 {
                            p.addLine(to: CGPoint(x: 8 + ((geo.size.width - 16) / 11) * index, y: geo.size.height - (CGFloat(logs[Int(index)].distance) * scale)))
                        }
                        index += 1
                    }

                    // Finally close the subpath off by looping around to the beginning point.
                    p.addLine(to: CGPoint(x: 8 + ((geo.size.width - 16) / 11) * (index - 1), y: geo.size.height))
                    p.addLine(to: CGPoint(x: 8, y: geo.size.height))
                    p.closeSubpath()
                }
            }
        )
}
If you now uncomment the call to draw the gradient in your body code you should see something similar to the following picture.
var body: some View {
    drawGrid()
    .opacity(0.2)
    .overlay(drawActivityGradient(logs: logs))
    //.overlay(drawActivityLine(logs: logs))
    //.overlay(drawLogPoints(logs: logs))
    //.overlay(addUserInteraction(logs: logs))
}
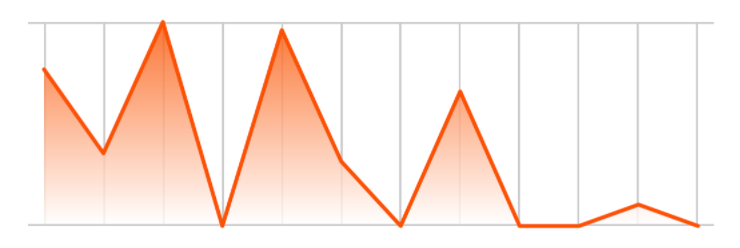
Drawing the Activity Line
The line drawing function works similarly to the gradient function. The only difference is we won't be closing off the path and using it as a mask. We'll simply draw the line and give it some color. See below for the drawActivityLine(logs:) function.
func drawActivityLine(logs: [ActivityLog]) -> some View {
    GeometryReader { geo in
        Path { p in
            let maxNum = logs.reduce(0) { (res, log) -> Double in
                return max(res, log.distance)
            }

            let scale = geo.size.height / CGFloat(maxNum)
            var index: CGFloat = 0

            p.move(to: CGPoint(x: 8, y: geo.size.height - (CGFloat(logs[0].distance) * scale)))

            for _ in logs {
                if index != 0 {
                    p.addLine(to: CGPoint(x: 8 + ((geo.size.width - 16) / 11) * index, y: geo.size.height - (CGFloat(logs[Int(index)].distance) * scale)))
                }
                index += 1
            }
        }
        .stroke(style: StrokeStyle(lineWidth: 2, lineCap: .round, lineJoin: .round, miterLimit: 80, dash: [], dashPhase: 0))
        .foregroundColor(Color(red: 251/255, green: 82/255, blue: 0))
    }
}
And once you uncomment the line in the body variable you should see something like the picture below in your preview canvas.
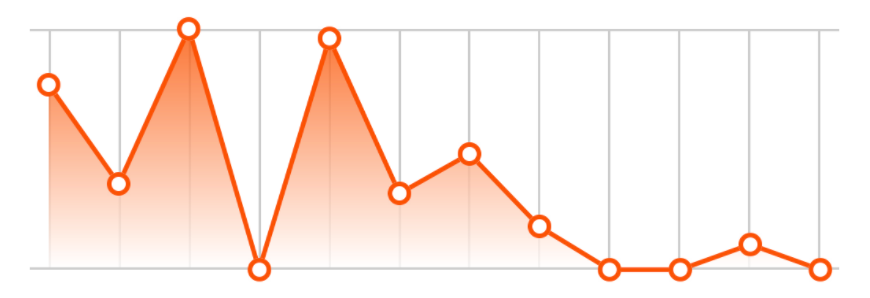
Drawing the Points
Once again our next function, drawLogPoints(logs:), is going to work like previous functions, except we will place Circle points on the graph as an overlay. See code below:
func drawLogPoints(logs: [ActivityLog]) -> some View {
    GeometryReader { geo in

        let maxNum = logs.reduce(0) { (res, log) -> Double in
            return max(res, log.distance)
        }

        let scale = geo.size.height / CGFloat(maxNum)

        ForEach(logs.indices) { i in
            Circle()
                .stroke(style: StrokeStyle(lineWidth: 4, lineCap: .round, lineJoin: .round, miterLimit: 80, dash: [], dashPhase: 0))
                .frame(width: 10, height: 10, alignment: .center)
                .foregroundColor(Color(red: 251/255, green: 82/255, blue: 0))
                .background(Color.white)
                .cornerRadius(5)
                .offset(x: 8 + ((geo.size.width - 16) / 11) * CGFloat(i) - 5, y: (geo.size.height - (CGFloat(logs[i].distance) * scale)) - 5)
        }
    }
}
And by uncommiting the line in the body variable to draw the points, you should get the following result in your canvas preview.
Adding User Interaction to Graph
We've now come to the final step in the construction of our graph. We're going to add the ability for the user to drag across the graph. This will display a vertical line depicting their selection along the graph.
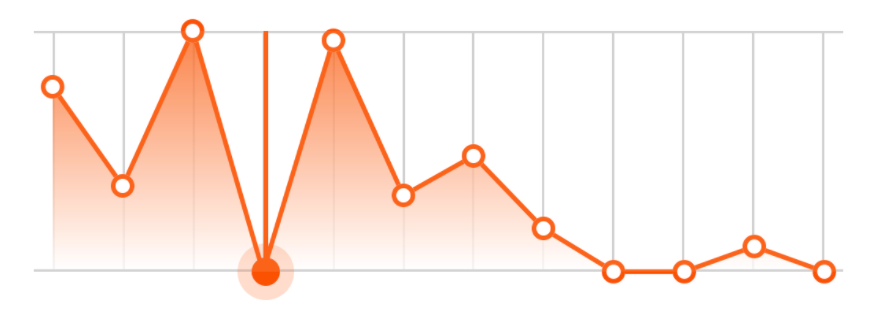
The way this works is by adding a DragGesture to the view, in which we will get the position of the user's touch location. Using that location we'll place a vertical line as well as a point which will follow along the activity line of the graph.
Again, we'll write a function that returns a View called addUserInteraction(logs:).
func addUserInteraction(logs: [ActivityLog]) -> some View {
    GeometryReader { geo in

        let maxNum = logs.reduce(0) { (res, log) -> Double in
            return max(res, log.distance)
        }

        let scale = geo.size.height / CGFloat(maxNum)

        ZStack(alignment: .leading) {
            // Line and point overlay

            // Future Drag Gesture Code

        }

    }
}
First let's design the vertical line and circle overlay.
func addUserInteraction(logs: [ActivityLog]) -> some View {
    GeometryReader { geo in

        let maxNum = logs.reduce(0) { (res, log) -> Double in
            return max(res, log.distance)
        }

        let scale = geo.size.height / CGFloat(maxNum)

        ZStack(alignment: .leading) {
            // Line and point overlay
            Color(red: 251/255, green: 82/255, blue: 0)
                .frame(width: 2)
                .overlay(
                    Circle()
                        .frame(width: 24, height: 24, alignment: .center)
                        .foregroundColor(Color(red: 251/255, green: 82/255, blue: 0))
                        .opacity(0.2)
                        .overlay(
                            Circle()
                                .fill()
                                .frame(width: 12, height: 12, alignment: .center)
                                .foregroundColor(Color(red: 251/255, green: 82/255, blue: 0))
                        )
                    , alignment: .bottom) // Aligned to bottom in order to accurately offset the circle.

            // Future Drag Gesture Code

        }

    }
}
In order for the view to follow the user's touch we'll need to offset the view, both for the vertical line and circle overlay. To do this we'll need to add a few new @State variables. The intent is for the vertical line to snap to the user's touch location when selected but then snap back to the nearest log point when the user lifts their finger.
@State var lineOffset: CGFloat = 8 // Vertical line offset
@State var selectedXPos: CGFloat = 8 // User X touch location
@State var selectedYPos: CGFloat = 0 // User Y touch location
@State var isSelected: Bool = false // Is the user touching the graph
Now with those variables defined, we can add in the code that offsets the views.
func addUserInteraction(logs: [ActivityLog]) -> some View {
    GeometryReader { geo in

        let maxNum = logs.reduce(0) { (res, log) -> Double in
            return max(res, log.distance)
        }

        let scale = geo.size.height / CGFloat(maxNum)

        ZStack(alignment: .leading) {
            // Line and point overlay
            Color(red: 251/255, green: 82/255, blue: 0)
                .frame(width: 2)
                .overlay(
                    Circle()
                        .frame(width: 24, height: 24, alignment: .center)
                        .foregroundColor(Color(red: 251/255, green: 82/255, blue: 0))
                        .opacity(0.2)
                        .overlay(
                            Circle()
                                .fill()
                                .frame(width: 12, height: 12, alignment: .center)
                                .foregroundColor(Color(red: 251/255, green: 82/255, blue: 0))
                        )
                        .offset(x: 0, y: isSelected ? 12 - (selectedYPos * scale) : 12 - (CGFloat(logs[selectedIndex].distance) * scale))
                    , alignment: .bottom)

                .offset(x: isSelected ? lineOffset : 8 + ((geo.size.width - 16) / 11) * CGFloat(selectedIndex), y: 0)
                .animation(Animation.spring().speed(4))

            // Future Drag Gesture Code

    }
}
With that in place we can move to adding the DragGesture code. We'll add this is an almost completely transparent view over the graph which will capture the user input.
func addUserInteraction(logs: [ActivityLog]) -> some View {
    GeometryReader { geo in

        let maxNum = logs.reduce(0) { (res, log) -> Double in
            return max(res, log.distance)
        }

        let scale = geo.size.height / CGFloat(maxNum)

        ZStack(alignment: .leading) {
            // Line and point overlay code from before
            // ....

            // Drag Gesture Code
            Color.white.opacity(0.1)
                .gesture(
                    DragGesture(minimumDistance: 0)
                        .onChanged { touch in
                            let xPos = touch.location.x
                            self.isSelected = true
                            let index = (xPos - 8) / (((geo.size.width - 16) / 11))

                            if index > 0 && index < 11 {
                                let m = (logs[Int(index) + 1].distance - logs[Int(index)].distance)
                                self.selectedYPos = CGFloat(m) * index.truncatingRemainder(dividingBy: 1) + CGFloat(logs[Int(index)].distance)
                            }


                            if index.truncatingRemainder(dividingBy: 1) >= 0.5 && index < 11 {
                                self.selectedIndex = Int(index) + 1
                            } else {
                                self.selectedIndex = Int(index)
                            }
                            self.selectedXPos = min(max(8, xPos), geo.size.width - 8)
                            self.lineOffset = min(max(8, xPos), geo.size.width - 8)
                        }
                        .onEnded { touch in
                            let xPos = touch.location.x
                            self.isSelected = false
                            let index = (xPos - 8) / (((geo.size.width - 16) / 11))

                            if index.truncatingRemainder(dividingBy: 1) >= 0.5 && index < 11 {
                                self.selectedIndex = Int(index) + 1
                            } else {
                                self.selectedIndex = Int(index)
                            }
                        }
                )
        }

    }
}
Constructing the Activity Stats Text
Now that we have the graph out of the way, we can move to the easier part of the project, which is displaying the activity stats. I went ahead and created a new SwiftUI view called ActivityStatsText and passed in the same parameters as the graph. I won't go into too much depth here, but I grouped the logs into weeks, just like the graph and displayed the milage, duration, and elevation stats for those weeks in the view. The selectedIndex variable is bound at the parent view which is the same one being provided to the graph. This way when the user taps on the graph, the stats text changes depending on the user's selected activity log.
struct ActivityHistoryText: View {

    var logs: [ActivityLog]
    var mileMax: Int

    @Binding var selectedIndex: Int

    var dateFormatter: DateFormatter {
        let formatter = DateFormatter()
        formatter.dateFormat = "MMM dd"
        return formatter
    }

    init(logs: [ActivityLog], selectedIndex: Binding<Int>) {
        self._selectedIndex = selectedIndex

        let curr = Date() // Today's Date
        let sortedLogs = logs.sorted { (log1, log2) -> Bool in
            log1.date > log2.date
        } // Sort the logs in chronological order

        var mergedLogs: [ActivityLog] = []

        for i in 0..<12 {

            var weekLog: ActivityLog = ActivityLog(distance: 0, duration: 0, elevation: 0, date: Date())

            for log in sortedLogs {
                if log.date.distance(to: curr.addingTimeInterval(TimeInterval(-604800 * i))) < 604800 && log.date < curr.addingTimeInterval(TimeInterval(-604800 * i)) {
                    weekLog.distance += log.distance
                    weekLog.duration += log.duration
                    weekLog.elevation += log.elevation
                }
            }

            mergedLogs.insert(weekLog, at: 0)
        }

        self.logs = mergedLogs
        self.mileMax = Int(mergedLogs.max(by: { $0.distance < $1.distance })?.distance ?? 0)
    }

    var body: some View {
        VStack(alignment: .leading, spacing: 16) {
            Text("\(dateFormatter.string(from: logs[selectedIndex].date.addingTimeInterval(-604800))) - \(dateFormatter.string(from: logs[selectedIndex].date))".uppercased())
                .font(Font.body.weight(.heavy))

            HStack(spacing: 12) {
                VStack(alignment: .leading, spacing: 4) {
                    Text("Distance")
                        .font(.caption)
                        .foregroundColor(Color.black.opacity(0.5))
                    Text(String(format: "%.2f mi", logs[selectedIndex].distance))
                        .font(Font.system(size: 20, weight: .medium, design: .default))
                }

                Color.gray
                    .opacity(0.5)
                    .frame(width: 1, height: 30, alignment: .center)

                VStack(alignment: .leading, spacing: 4) {
                    Text("Time")
                        .font(.caption)
                        .foregroundColor(Color.black.opacity(0.5))
                    Text(String(format: "%.0fh", logs[selectedIndex].duration / 3600) + String(format: " %.0fm", logs[selectedIndex].duration.truncatingRemainder(dividingBy: 3600) / 60))
                        .font(Font.system(size: 20, weight: .medium, design: .default))
                }

                Color.gray
                    .opacity(0.5)
                    .frame(width: 1, height: 30, alignment: .center)

                VStack(alignment: .leading, spacing: 4) {
                    Text("Elevation")
                        .font(.caption)
                        .foregroundColor(Color.black.opacity(0.5))
                    Text(String(format: "%.0f ft", logs[selectedIndex].elevation))
                        .font(Font.system(size: 20, weight: .medium, design: .default))
                }

                Spacer()
            }

            VStack(alignment: .leading, spacing: 5) {
                Text("LAST 12 WEEKS")
                    .font(Font.caption.weight(.heavy))
                    .foregroundColor(Color.black.opacity(0.7))
                Text("\(mileMax) mi")
                    .font(Font.caption)
                    .foregroundColor(Color.black.opacity(0.5))
            }.padding(.top, 10)


        }
    }
Activity Stats View
And here is the parent view which holds both the graph and the text views
struct ActivityHistoryView: View {

    @State var selectedIndex: Int = 0

    var body: some View {
        VStack(spacing: 16) {
            // Stats
            ActivityHistoryText(logs: ActivityTestData.testData, selectedIndex: $selectedIndex)

            // Graph
            ActivityGraph(logs: ActivityTestData.testData, selectedIndex: $selectedIndex)

        }.padding()
    }
}
Download Full Project
Full project source code can be downloaded from here:
Download Source CodeLike this tutorial?
Show us what you've made!
Send us pics! Drop us a link! Anything! Find us on Twitter @TrailingClosure, on Instagram, or email us at [email protected].